Revenue Stacking Example
How a GB battery layers day-ahead arbitrage, Dynamic Containment (DC-High), and a fixed Capacity Market payment across one day — and how the CM reserve floor trades off against arbitrage.
Download the Revenue Stacking Example diagram
Free to download and reuse — including commercially — under CC BY 4.0, with credit to BESS.engineer. Licence & attribution →
Browse all BESS diagrams →
What it shows
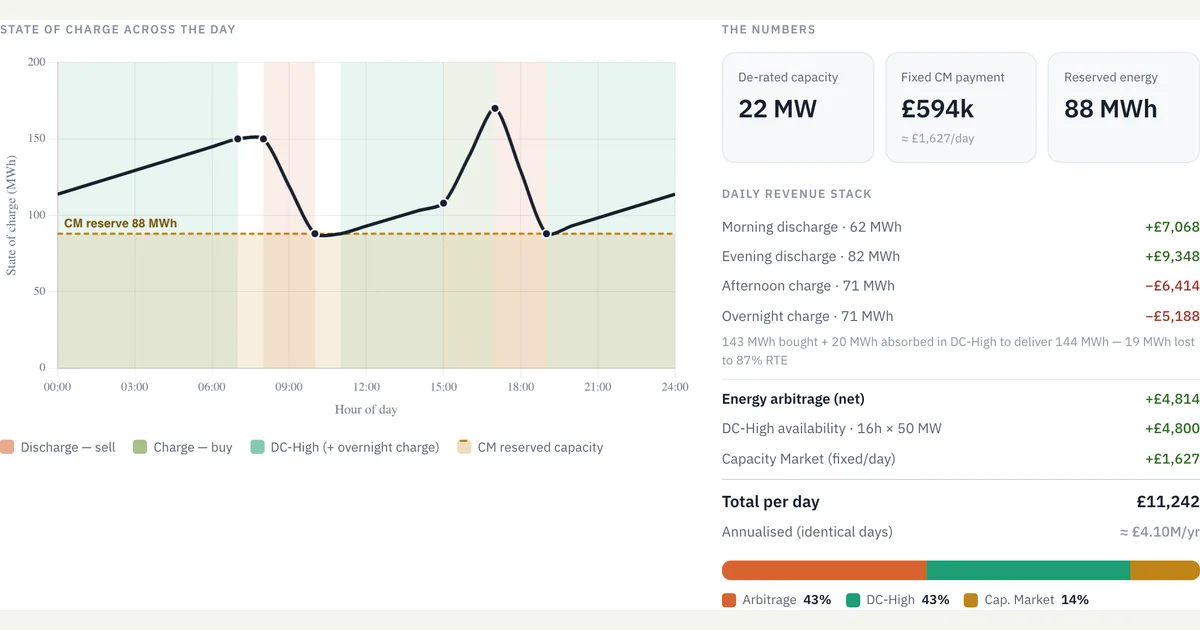
A single day in the life of a 50 MW / 200 MWh battery, traced as state of charge across 24 hours. Coloured bands mark when the battery discharges to sell into the morning and evening peaks, charges from cheap afternoon and overnight power, and holds capacity for Dynamic Containment High (DC-High). A gold dashed line is the Capacity Market reserve floor — the energy the battery must keep available to honour its CM agreement. The revenue stack on the right adds three streams into a daily and annualised total, and every input (de-rating factor, CM clearing price, stress duration, round-trip efficiency, and the buy/sell prices) is adjustable.
Why it matters for BESS
No single market pays enough to underwrite a grid-scale battery on its own — bankable projects stack several. Arbitrage is the variable, price-driven layer; ancillary services like DC-High pay for availability; and the Capacity Market is a fixed annual payment regardless of activation. The tension this visual makes concrete is that a higher CM reserve lifts the state-of-charge floor, holding energy back from the peak and eating into arbitrage. Seeing the three streams share one battery, one day, and one state-of-charge curve is how the trade-offs become tractable.
How to read it
Follow the state-of-charge line: it falls during discharge (sell) windows and rises during charge (buy) windows, resting on the gold reserve floor through the evening peak. Where the floor sits above the planned trough, the held-back energy is subtracted from arbitrage. The round-trip-efficiency line shows why more energy is bought than delivered: at 87% RTE, roughly 19 MWh of every day’s throughput is lost as heat. The split bar attributes the daily total across arbitrage, DC-High, and the Capacity Market.
Frequently asked
- What is battery revenue stacking?
- Revenue stacking is operating one battery across several markets so the income layers add up — typically energy arbitrage, frequency-response or ancillary services, and a capacity payment. Each stream has a different risk and payment basis, and stacking them is what makes a grid-scale battery bankable.
- How does the Capacity Market reserve affect arbitrage?
- A Capacity Market agreement requires the battery to keep a minimum amount of energy available to deliver during a stress event. If that reserve floor sits above the trough the battery would otherwise discharge to, the held-back energy cannot be sold into the peak — so a larger reserve directly reduces arbitrage volume, while the CM payment itself stays fixed.
- What is DC-High (Dynamic Containment)?
- Dynamic Containment High is GB’s fast post-fault frequency-response service. When grid frequency rises above 50 Hz, DC-High units absorb power — for a battery that means charging — to help arrest the deviation. It pays for availability across the contracted window rather than for energy delivered.
- Does revenue stacking wear the battery out faster?
- It can, because the streams cycle the battery very differently. Energy arbitrage is the throughput-heavy layer — it charges and discharges deeply every day, consuming the warranty-limited equivalent full cycles — while availability services like the Capacity Market and Dynamic Containment mostly pay the battery to sit ready and barely cycle it. A bankable model therefore nets arbitrage and DC-High revenue against a per-MWh degradation cost, and the optimiser stops stacking a stream once its marginal revenue no longer beats the cycle it costs, so the highest-earning dispatch is rarely the one that runs the battery hardest.
References
Standards and authoritative sources this visual is built on:
- Dynamic Containment Service Terms
- Capacity Market Rules (Electricity Market Reform)
- The Value of Energy Storage for Grid Applications (NREL/TP-6A20-58465)
- Electricity Storage Valuation Framework: Assessing system value and ensuring project viability