Energy Source Evolution
How the primary-energy mix shifted from biomass to fossil fuels to renewables — and the storage medium each source relies on, ending in batteries.
Download the Energy Source Evolution diagram
Free to download and reuse — including commercially — under CC BY 4.0, with credit to BESS.engineer. Licence & attribution →
Browse all BESS diagrams →
What it shows
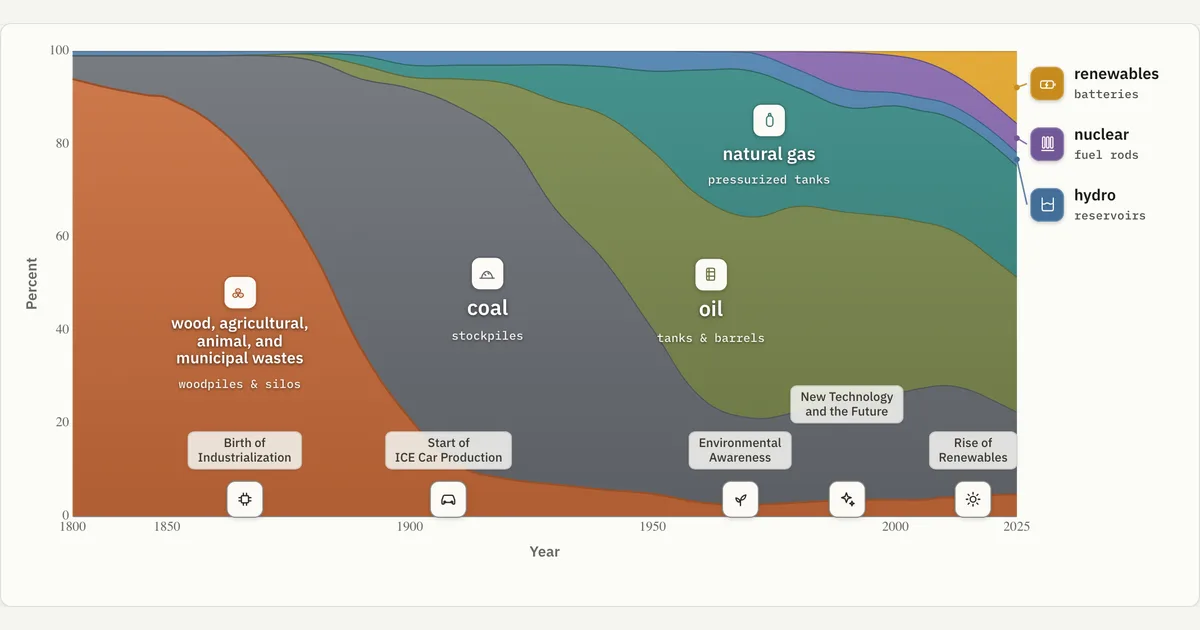
Energy Source Evolution is a stacked-area chart of the U.S. primary-energy mix from 1800 to 2025, normalized to 100% each year, with the 1800–1850 span compressed. Seven sources — biomass, coal, oil, natural gas, hydro, nuclear, and renewables — are each paired with the medium that stores them, from woodpiles and stockpiles to tanks, reservoirs, fuel rods, and finally batteries. Milestone markers flag the industrial, automotive, and renewable turning points.
Why it matters for BESS
Every energy source in this chart depends on a way to hold its energy until it is needed: coal in stockpiles, oil in tanks and barrels, gas under pressure, hydro behind reservoir dams. Renewables — wind and solar — produce electricity that cannot be stockpiled as fuel, so their storage medium is the battery. This is the throughline the visual makes concrete: as the gold renewables band climbs after 2000, grid-scale batteries become the storage layer of the modern energy system, which is exactly what a BESS is.
How to read it
Read vertically at any year: each coloured band is that source's share of the 100% total, so the bands always sum to full height. Follow biomass (94% in 1800) collapsing as coal rises to dominate by the early 1900s, then oil and natural gas taking the mid-century, and the gold renewables band rising steeply after 2000 to roughly 15% by 2025. The small badges name each source's storage medium; hover any year for the exact percentage breakdown. Note the horizontal axis is compressed across 1800–1850, so early decades are narrower than later ones.
Frequently asked
- What does the Energy Source Evolution chart show?
- It shows the share of global primary energy supplied by each source — biomass, coal, oil, natural gas, hydro, nuclear, and renewables — from 1800 to 2025, normalized so each year sums to 100%. Each source is paired with the medium that stores it, and renewables' medium is the battery. The shape follows the U.S. historical record and is illustrative, with pre-1900 and post-2000 figures as estimates.
- Why is renewables' storage medium a battery?
- Fossil fuels store their energy chemically and can be stockpiled — coal in piles, oil in tanks, gas under pressure — until burned on demand. Wind and solar instead produce electricity directly and intermittently, which cannot be stored as a fuel. Batteries hold that electricity as charge and release it when generation drops or demand rises, making a grid-scale BESS the storage medium of the renewable era shown in the chart's gold band.
- How much of the energy mix is renewables by 2025 in this chart?
- Renewables reach roughly 15% of the primary-energy mix by 2025 in this illustrative view, up from near zero before 1980 and about 1% in 2000. Over the same span coal falls from its early-1900s dominance to about 17%, while oil and natural gas together still supply the largest combined share. Hover any year in the chart for the exact per-source percentages.
- Why is the early part of the timeline compressed?
- The horizontal axis is deliberately compressed across 1800–1850 so the slow-changing early nineteenth century does not crowd out the faster transitions of the twentieth and twenty-first. Anchor years — 1800, 1850, 1900, 1950, 2000, 2025 — mark the scale, and because each year is rescaled to 100%, the bands show relative share rather than absolute energy, keeping the focus on how the mix shifted over time.
References
Standards and authoritative sources this visual is built on:
- Energy Transitions: Global and National Perspectives, 2nd Edition
- Monthly Energy Review — Primary Energy Consumption by Source (long-run U.S. historical energy estimates)
- Statistical Review of World Energy (primary energy by fuel, historical to current)
- Batteries and Secure Energy Transitions