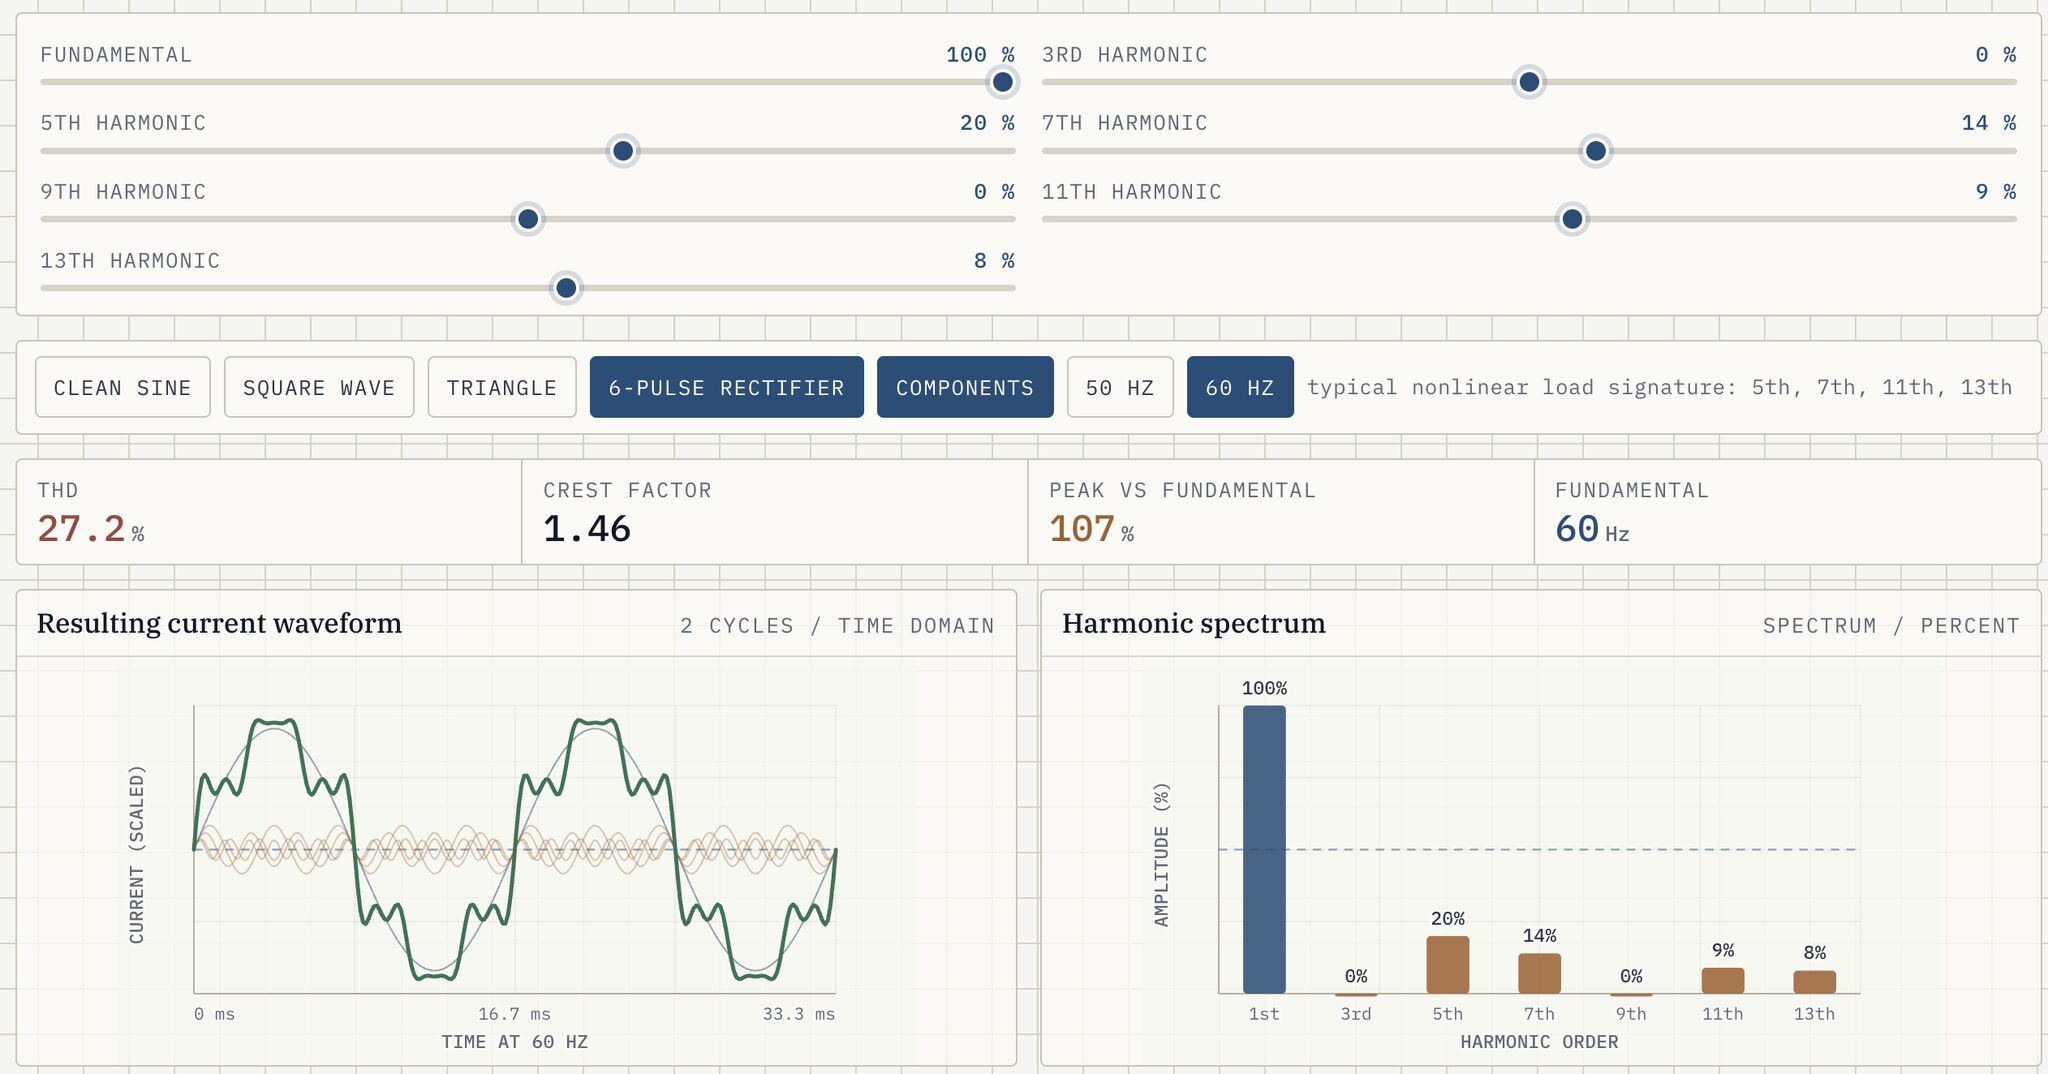
We often talk about harmonics in theory, but the concept becomes much easier to understand when you can actually see how different harmonic components distort a waveform.
Add enough of them, with the right amplitudes and phases, and a smooth sine wave can start to look like a square wave, a sawtooth, or many other periodic shapes — all from stacking simple waves on top of each other.
Honestly, I wish a visualization like this had existed when I was at university. It would have made the topic much more intuitive than looking only at formulas and static plots.
Adjust the sliders and explore how each harmonic changes the waveform on the Current Harmonics & THD visual.