PWM: Building a Sine from a DC Bus
Four IGBTs chop an 800 V battery bus thousands of times a second; an LC filter recovers the 60 Hz sine the grid wants. Trade harmonic distortion against switching heat.
Download the PWM: Building a Sine from a DC Bus diagram
Free to download and reuse — including commercially — under CC BY 4.0, with credit to BESS.engineer. Licence & attribution →
Browse all BESS diagrams →
What it shows
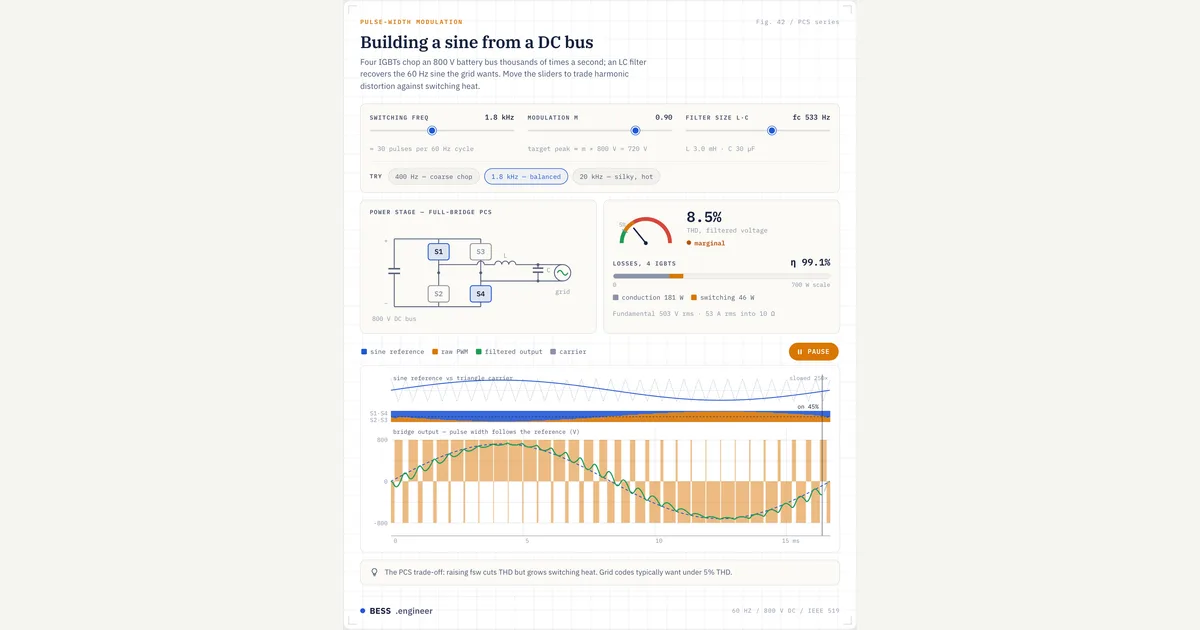
Pulse-width modulation is how a battery inverter (PCS) builds a 60 Hz AC sine from a fixed 800 V DC bus. Four IGBTs (S1-S4) in a full bridge switch the bus positive or negative thousands of times a second, and an LC low-pass filter smooths the chopped pulses into the sinusoid the grid wants. Sliders set switching frequency, modulation index m, and filter size; live meters read THD and IGBT loss.
Why it matters for BESS
Every BESS stores DC but must deliver clean AC, and the PCS does that conversion through PWM. The core trade-off this visual makes concrete is that a higher switching frequency chops the bus more finely, so the filter hides the ripple better and THD falls, but each switching event burns energy in the IGBTs, growing switching loss and heat. A lower output-voltage THD means a cleaner waveform, but note what IEEE 519 actually obligates an inverter to: the harmonic current (TDD) it injects at the point of common coupling, not its own terminal-voltage THD (voltage-THD limits, ~5% on 1-69 kV buses, are the utility’s supply-side duty). Filter and switching frequency are ultimately sized against that current-harmonic budget, so designers pick the lowest switching frequency that still meets it to protect efficiency.
How to read it
The oscilloscope stacks three lanes over one 60 Hz cycle: the blue sine reference against the grey triangle carrier, the S1-S4 / S2-S3 gate on-time share that swells at the sine crest, and the amber raw bridge voltage with the green filtered sine emerging. The THD gauge is green under 5% (clean output), amber to 10% (marginal), red beyond. The loss bar splits conduction (grey) from switching (amber) against a 700 W scale, and the efficiency figure updates alongside.
Frequently asked
- What is PWM in a battery inverter?
- Pulse-width modulation is the technique a PCS uses to synthesize AC from a DC bus. It compares a low-frequency sine reference against a high-frequency triangle carrier; wherever the reference is higher, the bridge connects the +800 V rail, otherwise the -800 V rail. The pulse widths vary so their short-term average traces the desired sine, which an LC filter then smooths into a clean 60 Hz output.
- Why does a higher switching frequency reduce THD but increase losses?
- More switching cycles per 60 Hz period place the harmonic content at higher frequencies that the LC filter attenuates more easily, so total harmonic distortion drops. But every turn-on and turn-off dissipates energy in the IGBTs, and that switching loss scales with frequency. At 400 Hz the chop is coarse (high THD, cool silicon); at 20 kHz the sine is silky but the IGBTs run hot. Designers pick the lowest frequency that still meets the THD limit.
- What is the modulation index m and what is overmodulation?
- The modulation index m is the amplitude ratio of the sine reference to the carrier peak; it sets the fundamental output, with target peak roughly m times 800 V. At m of about 0.9 the inverter operates linearly. When m exceeds 1.0 the reference pokes above the carrier peak, so pulses drop out and the output sine flat-tops, adding low-order harmonics that the LC filter cannot remove.
- How much THD does the grid allow?
- IEEE 519 sets harmonic limits at the point of common coupling — for an inverter these are current-distortion (TDD) limits plus a supply-side voltage-THD limit (about 5% on 1-69 kV buses). This visual shows the PCS output-voltage THD as a waveform-quality proxy: the gauge reads green below 5% (clean), amber from 5 to 10% (marginal), and red above 10%, so the goal is to keep the filtered output in the green band while holding switching loss down.
References
Standards and authoritative sources this visual is built on:
- IEEE 519-2022 — IEEE Standard for Harmonic Control in Electric Power Systems
- IEEE 2800-2022 — IEEE Standard for Interconnection and Interoperability of Inverter-Based Resources (IBRs) Interconnecting with Associated Transmission Electric Power Systems (harmonic/power-quality requirements)
- IEEE 1547-2018 — IEEE Standard for Interconnection and Interoperability of Distributed Energy Resources with Associated Electric Power Systems Interfaces (Clause 7, power quality / harmonic current limits)
- Power Electronics: Converters, Applications, and Design (3rd ed.) — sinusoidal PWM, modulation index, overmodulation, and full-bridge inverter theory